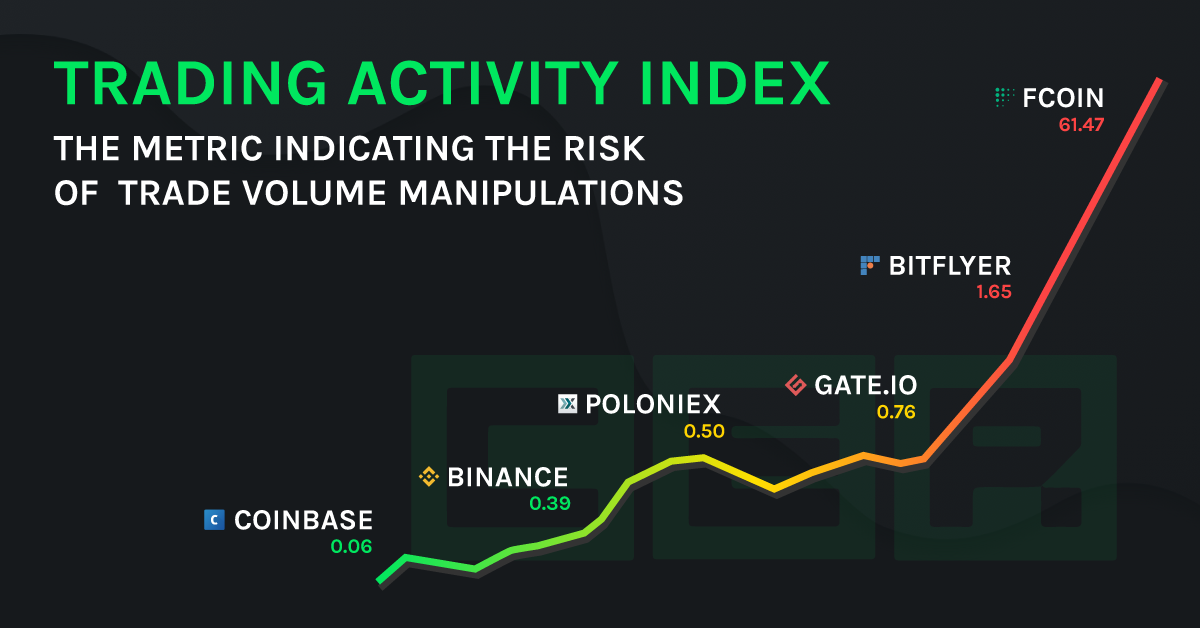
The problem of fake volumes reported by crypto exchanges became broadly discussed as a number of reports by different dedicated companies have been published. Following the buzz, the leading cryptocurrency data aggregators are now in pursuit of a more transparent way of combating such malpractices that ends up harming the trader community while also causing damage to the blockchain industry’s reputation. In an effort to help identify suspicious trade volumes, cybersecurity firm Hacken through its CER (Crypto Exchange Ranks) initiative has created an indicator that will help you identify suspicious trade volumes across multiple exchanges.

CER believes that the total balance on exchanges wallets is the most relevant and reliable metric for ranking crypto exchanges to date. It can serve as a proof of solvency and a measure of the platforms "real volume" capability. And in relation to trade volume reported by the exchange, it can help to justify whether the trading activity is inflated or not. Thus, the CER team decided to calculate Trading Activity Index (TAI) which is the ratio of total wallets balance to reported trade volume.
TAI shows how many times the deposited funds traded over the past 24 hours. We consider a high TAI indicates the high risk (probability) of inflated reported volume. For example, TAI value of 0.1 means that 10 % of the deposited funds were turned over the day, and TAI value of 1 indicates that all the deposited funds were turned over the course of 24 hours and that is quite suspicious wouldn’t you agree? Needless to say, when turnover is above funds available, this tells us of the high probability of volume manipulation on the exchange.
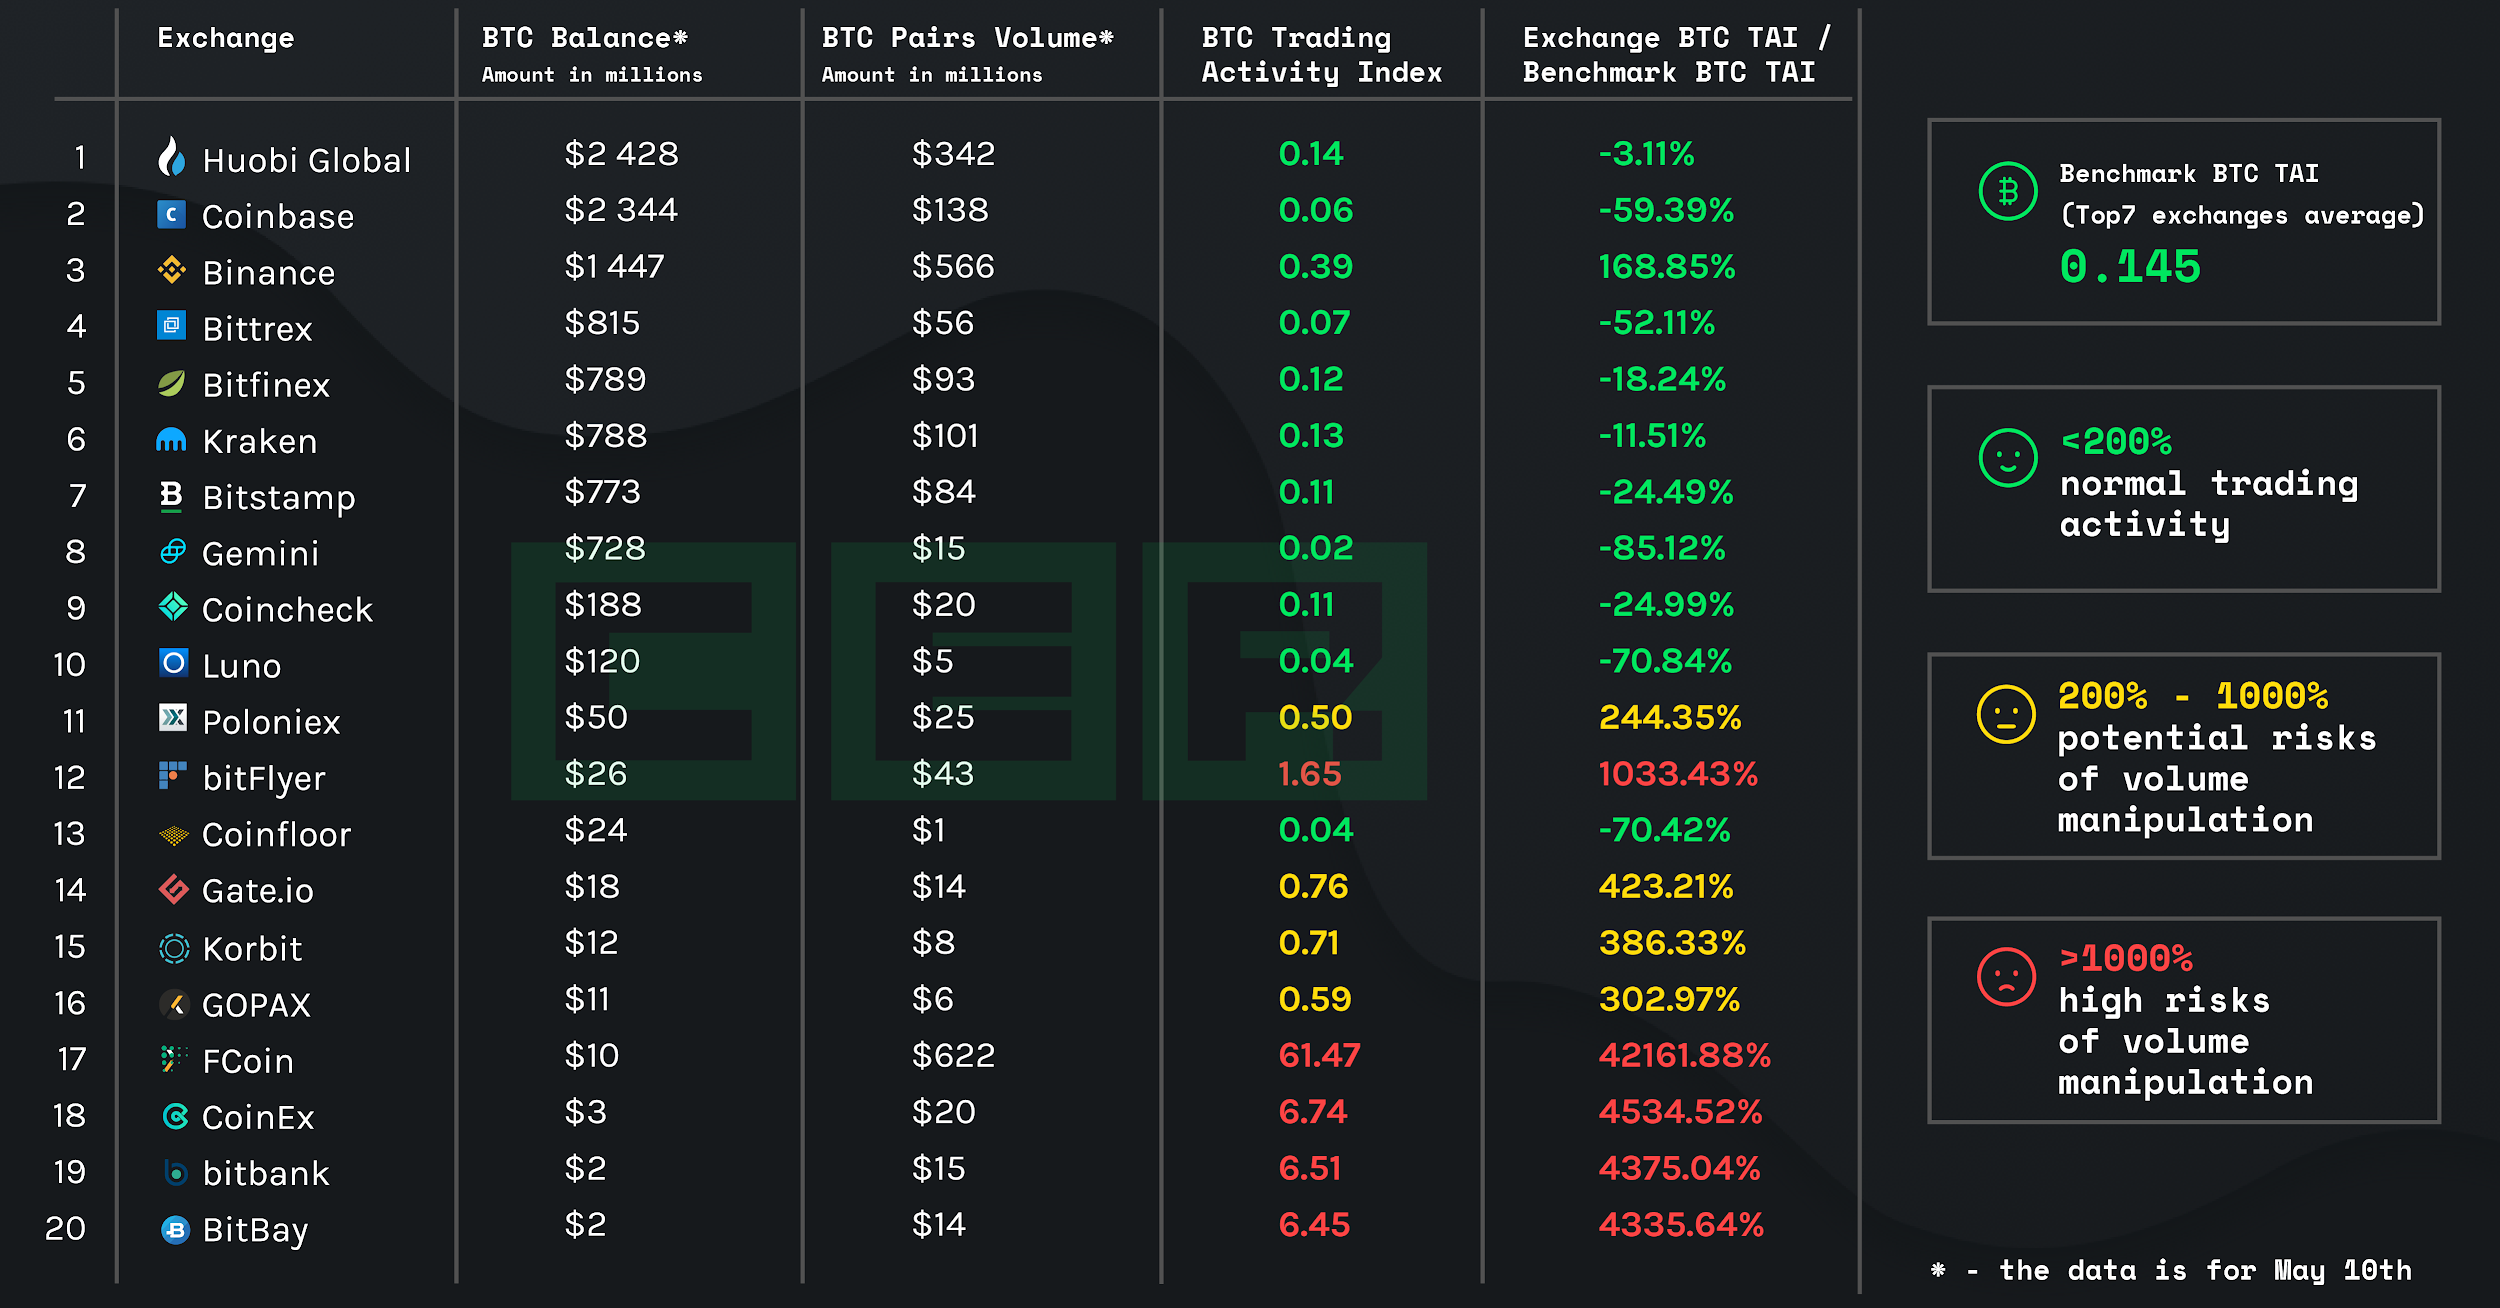
For our TAI calculation, we took 30 largest exchanges by total wallet balance, retrieved the total balances of BTC wallets and total volume for all BTC pairs (either as a base or quoted currency) for each exchange. Then we computed the ratio of the two which we dubbed BTC TAI since all input data was for BTC (wallets and pairs).
A number of exchanges were excluded from the table for which we believe we have insufficient wallet balance data available to date. These include OKex, Kucoin, HitBTC, ZB and UPbit. We strongly encourage these exchanges to provide their wallet addresses to CER to be able to receive the Proof of Funds CERtificate ensuring their transparency.
Do you trade on any of these exchanges? Make your voice heard by announcing such certification exists so that you, the trader, may certify that you're trading on a secure and transparent exchange.
Then we derived the benchmark BTC TAI value of 0.145 which is an average for the 7 largest exchange. Based on that we calculated the percentage ratio of each exchange BTC TAI to the benchmark value less 100% which shows the percentage difference between the two. The magnitude of the difference indicates the risk level of volume manipulations. We consider the values below 200% low risk, 200-1000% - potential risk and over 1000% - high risk. Thus, in the table/picture we can see that some exchanges deviate from the TAI benchmark by thousands of percentage points which suggests an extremely high probability of trade volume manipulations.

You can check the live ranking of crypto exchanges by wallet balances on CER platform.
Disclaimer
BTC trade volume data is according to CMC for the 10th of May, 2019. The aggregate BTC wallet balance data was acquired from our partner Crystal and CER platform. CER cannot guarantee 100% completeness and accuracy of the data unless the exchange provides the data directly.
CER tried to reach out to each trading platform in the list via e-mail to provide each exchange a chance to verify the data we have. Liquid was the only exchange to respond and eventually it was excluded from the report due to the technical inability to distinguish spot volume from the total volume number.

CER believes that the total balance on exchanges wallets is the most relevant and reliable metric for ranking crypto exchanges to date. It can serve as a proof of solvency and a measure of the platforms "real volume" capability. And in relation to trade volume reported by the exchange, it can help to justify whether the trading activity is inflated or not. Thus, the CER team decided to calculate Trading Activity Index (TAI) which is the ratio of total wallets balance to reported trade volume.
TAI shows how many times the deposited funds traded over the past 24 hours. We consider a high TAI indicates the high risk (probability) of inflated reported volume. For example, TAI value of 0.1 means that 10 % of the deposited funds were turned over the day, and TAI value of 1 indicates that all the deposited funds were turned over the course of 24 hours and that is quite suspicious wouldn’t you agree? Needless to say, when turnover is above funds available, this tells us of the high probability of volume manipulation on the exchange.
For our TAI calculation, we took 30 largest exchanges by total wallet balance, retrieved the total balances of BTC wallets and total volume for all BTC pairs (either as a base or quoted currency) for each exchange. Then we computed the ratio of the two which we dubbed BTC TAI since all input data was for BTC (wallets and pairs).
A number of exchanges were excluded from the table for which we believe we have insufficient wallet balance data available to date. These include OKex, Kucoin, HitBTC, ZB and UPbit. We strongly encourage these exchanges to provide their wallet addresses to CER to be able to receive the Proof of Funds CERtificate ensuring their transparency.
Do you trade on any of these exchanges? Make your voice heard by announcing such certification exists so that you, the trader, may certify that you're trading on a secure and transparent exchange.
Then we derived the benchmark BTC TAI value of 0.145 which is an average for the 7 largest exchange. Based on that we calculated the percentage ratio of each exchange BTC TAI to the benchmark value less 100% which shows the percentage difference between the two. The magnitude of the difference indicates the risk level of volume manipulations. We consider the values below 200% low risk, 200-1000% - potential risk and over 1000% - high risk. Thus, in the table/picture we can see that some exchanges deviate from the TAI benchmark by thousands of percentage points which suggests an extremely high probability of trade volume manipulations.

You can check the live ranking of crypto exchanges by wallet balances on CER platform.
Disclaimer
BTC trade volume data is according to CMC for the 10th of May, 2019. The aggregate BTC wallet balance data was acquired from our partner Crystal and CER platform. CER cannot guarantee 100% completeness and accuracy of the data unless the exchange provides the data directly.
CER tried to reach out to each trading platform in the list via e-mail to provide each exchange a chance to verify the data we have. Liquid was the only exchange to respond and eventually it was excluded from the report due to the technical inability to distinguish spot volume from the total volume number.


