

An upwards price correction attempt was evident during last week’s trading sessions and pushed ethereum price upwards to record a week high of $417.85 on Bitfinex. However, the bullish momentum could not be maintained and ethereum price started dropping after the week high was scored, dropping down to a week low of $363. The beginning of the current week was marked by ethereum price shooting up to $430, to temporarily breach the resistance around $412.78, before dropping again below this seemingly strong resistance level.
Where can we expect ethereum price to be during the current week?
Repeated pattern evident on the 4 hour ETHUSD chart:
Let’s study the 4 hour ETHUSD chart from Bitfinex, while plotting the Williams Alligator’s SMAs, the MACD indicator, and the 50 period SMA (the green curve) as shown on the below chart. We can note the following:

- To identify basic resistance and support levels as per the current market conditions, we will plot Fibonacci retracements that extend between the high recorded on March 21st ($590.11) and the low recorded on April 1st ($358). As shown on the above chart, the resistance around the 23.6% Fibonacci retracement ($412.78) was tested twice during the past week or so. During both incidents, ethereum price overshot temporarily above this important resistance level, and then dropped below it. At the beginning of the new week, ethereum price bounced off this level after recording a day high of $430 on Monday.
- Since the beginning of April, ethereum price has been oscillating between $358 and $412.78. Upwards price movements are reversed near $412, and downwards price movements are reversed near $358. We can expect ethereum price to continue moving as per the same pattern also this week, before breaking out of the $358-$412.78 price range. Early during the current week, ETH price will most probably drop towards $358 again, then rise to test the resistance around $412.78 for the third time during the last 10 days. Chances are better that this resistance level, which corresponds to the 23.6% Fibonacci retracement, will be broken later this week, due to the fact that repeated testing of a resistance level weakens it.
- Ethereum price is way below the 50 period SMA, which is acting as a resistance level, as evidenced by the long upwards shadow of candlestick near the level of this important moving average. The price is also below both of the 20 period and 100 period SMAs. The 20, 50, and 100 period SMAs are also exhibiting a bearish alignment. The 50 period SMA is in the middle of the 100 period SMA on top and the 20 period SMA from below.
- From the upside, the resistance levels are the 23.6 Fibonacci retracement ($412.78) followed by the 38.2% Fibonacci retracement ($446.67). We can mostly witness ETH price rise towards $446.67 after it bounces off the support level around $358, as evidenced by two important bullish signals. The SMAs of the Williams Alligator have just rearranged themselves to exhibit a bullish alignment, so the alligator’s mouth has just opened and will start eating in the bullish direction. The MACD has also moved into the positive territory, and is sloping in an upwards direction, with the blue MACD line crossing above the red signal line.
- From the downside, if the support level around $358 is breached (which is highly unlikely), the next support level will be around $273.50.
Ethereum is oversold on 1 day ETHUSD chart:
Now, let’s examine the 1 day ETHUSD chart from Bitfinex, while plotting the Ichimoku Cloud and the RSI indicator. We will keep the Fibonacci retracements we plotted during our previous ethereum price weekly analysis on April 4th. We can note the following:
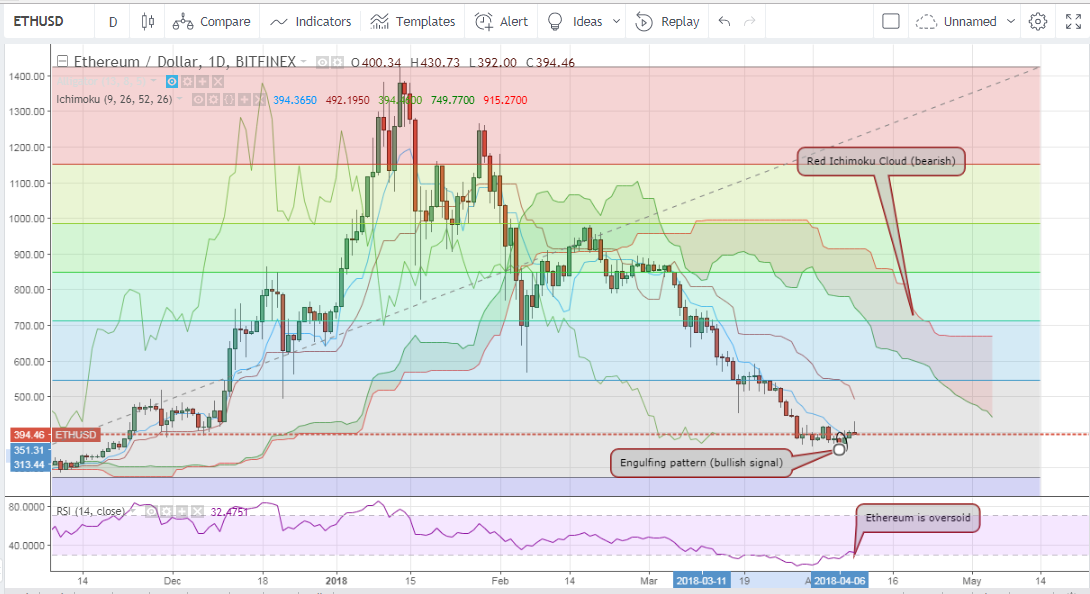
- The Ichimoku Cloud is still red (bearish) and ethereum price is still below the cloud.
- The upwards price movement that we are expecting to occur this week towards $446.67 is supported by the RSI which signals that ethereum is oversold at the current price. Moreover, an “engulfing” candlestick pattern is evident on the chart and signals an upwards price movement.
Conclusion:
Ethereum price rose slightly last week to temporarily break through the resistance around $412.78, before dropping again below this strong resistance level. Even though ethereum price has been moving through a fixed range ($358-$412.78) during the past week, our technical analysis is in favor of rise towards $446.67 during the upcoming week.
Charts from Bitfinex. hosted on Tradingview.com
