Bitcoin cash price fell progressively during Wednesday's trading sessions to a day low of $1,196. The downtrend was reversed during Thursday's early sessions and began rising from an opening price of $1,202, reaching a high of $1,306, at the time of writing of this analysis. Bitcoin cash price has successfully breached the resistance level around $1,278.14, which corresponds to the 23.6% Fibonacci retracement.
Will bitcoin cash price continue rising? Or, shall we see a downwards price correction attempt during the next few days?
We will study the 4 hour BCHUSD chart from Bitfinex, while plotting the 50 period SMA, the 100 period SMA, and the Bollinger Bands indicator, as shown on the below chart. We have zoomed in the chart after extending Fibonacci retracements between a low of $758.61 and a high of $2,960. We can note the following:

Bitcoin cash price managed to temporarily break through the resistance around the 23.6% Fibonacci retracement level, recording a high of $1,306 during Thursday's early sessions. A new ascending triangle is now evident on the chart, so bitcoin cash price will most probably fall again below this crucial resistance level. Thereafter, an upward trend will most probably become evident after bouncing off the newly observed rising support level around $1,240.
Chart from Bitfinex, hosted on Tradingview.com
Will bitcoin cash price continue rising? Or, shall we see a downwards price correction attempt during the next few days?
Rising support level evident on the 4 hour BCHUSD chart:
We will study the 4 hour BCHUSD chart from Bitfinex, while plotting the 50 period SMA, the 100 period SMA, and the Bollinger Bands indicator, as shown on the below chart. We have zoomed in the chart after extending Fibonacci retracements between a low of $758.61 and a high of $2,960. We can note the following:

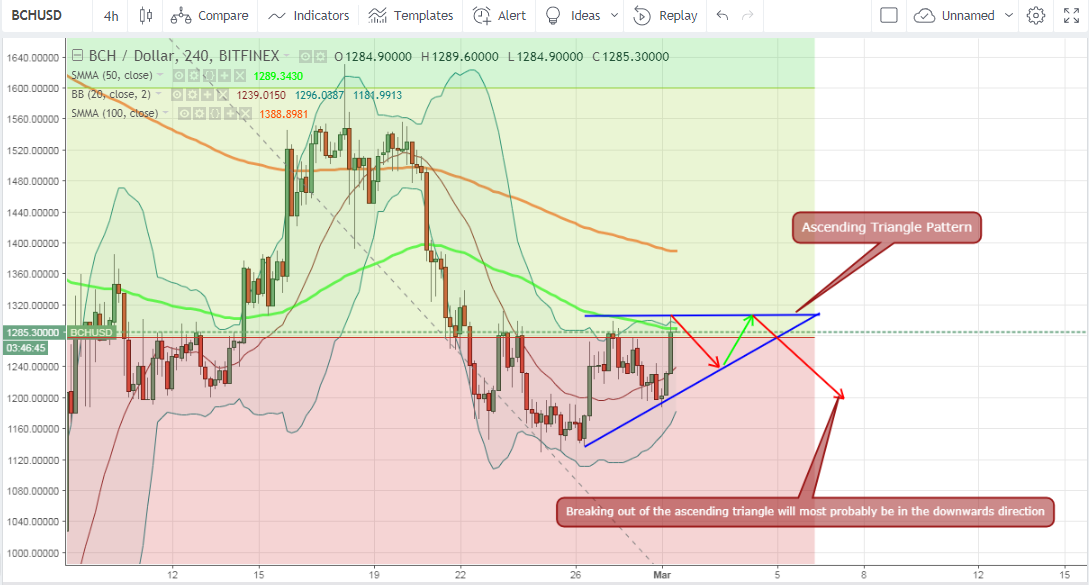
- Even though BCH price dropped down to $1,186 during Thursday's first four hour trading session, it rose within the following eight hours to a high of $1,202. A rising support level (upwards sloping blue trend line on the above chart) has been evident since February 26th. The market's bulls have just managed to break through the resistance level around $1,278.14 (23.6% Fibonacci retracement). However, bitcoin cash price will most probably fall again below this critical resistance level, similarly to what happened last Tuesday.
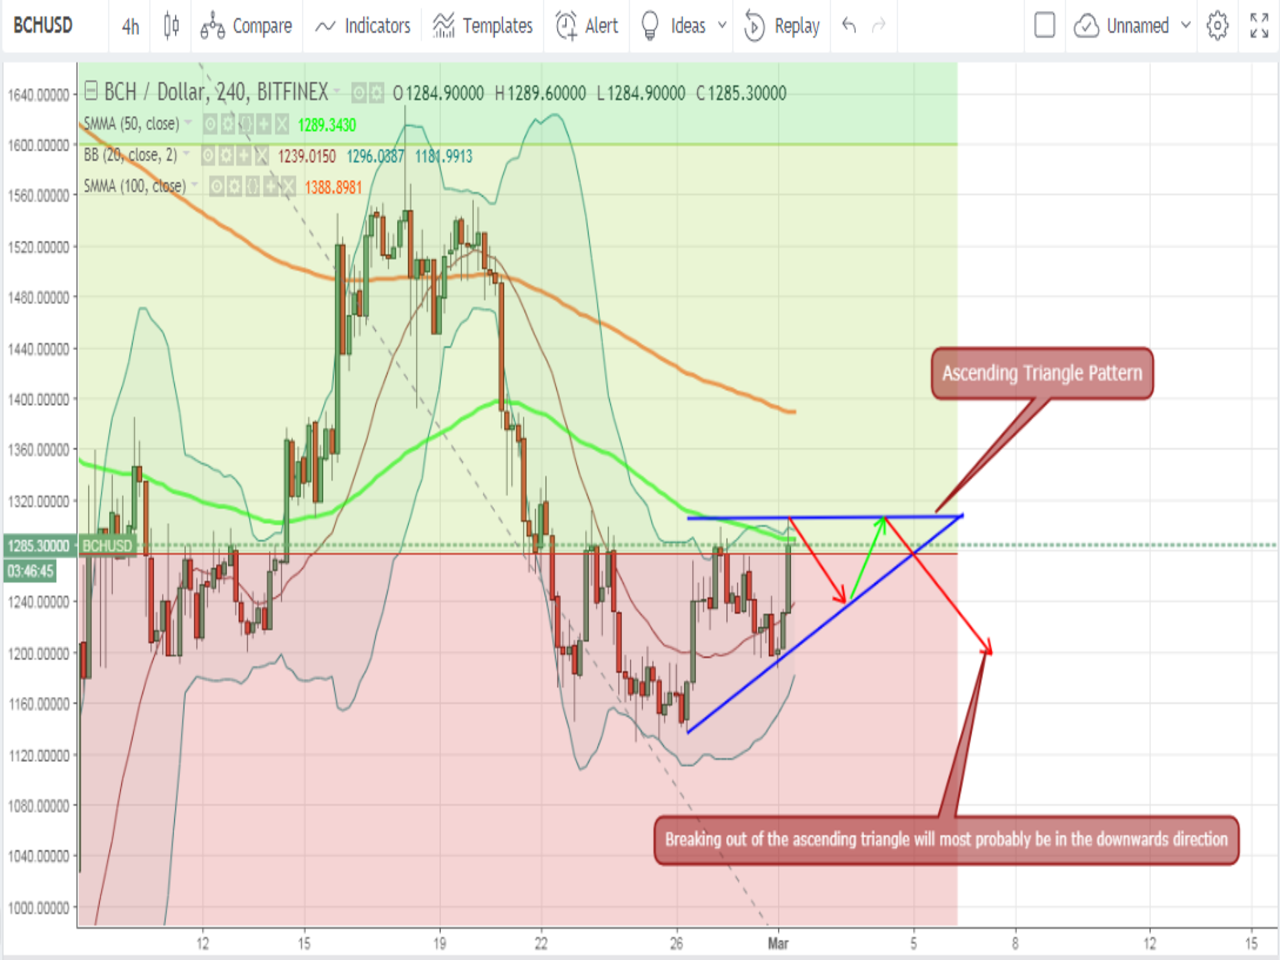
- Starting from last Tuesday, swing highs of bitcoin cash price have relatively been on the same level (horizontal blue trend line on the above chart). The rising support level and the horizontal level of swing highs have led to the formation of an "ascending triangle" pattern. BCH price has just bounced off the upper border of the ascending triangle and will most probably drop down to bounce off the rising support level within the next 48 hours as per the red arrow on the chart. Breaking out of the ascending triangle pattern will mostly be in the bearish direction, unless candlesticks rise well above the level of the 50 period SMA.
- The market's bulls won't be able to maintain bitcoin cash price above the level of $1,278.14 for long, especially that candlesticks are currently tangential to the upper Bollinger band. As such, BCH is somehow overbought at the current market conditions, so we will most likely see price drop near the level of the middle Bollinger band where the market could be more stable. $1,240 is a reasonable target on the downside, after which price can rise again towards the upper border of the ascending triangle.
- Bitcoin cash price is way below the 100 period SMA. It is also below the 50 period SMA, which is acting as a resistance level preventing a move towards the upside.
Conclusion:
Bitcoin cash price managed to temporarily break through the resistance around the 23.6% Fibonacci retracement level, recording a high of $1,306 during Thursday's early sessions. A new ascending triangle is now evident on the chart, so bitcoin cash price will most probably fall again below this crucial resistance level. Thereafter, an upward trend will most probably become evident after bouncing off the newly observed rising support level around $1,240.
Chart from Bitfinex, hosted on Tradingview.com

