A strong bearish wave has been evident across bitcoin cash markets since Tuesday's early trading sessions. BCH price dropped by around 7% during a 24 hour period. Bitcoin cash price dropped from Tuesday's opening price of $1,257 down to $1,139 during Wednesday's early sessions, before rising again to $1,180 at the time of writing of this analysis.
Will this strong bearish wave be broken soon?
(Note: the market is currently exhibiting high levels of volatility, so trade wisely and never invest more than what you can afford to lose).
We will examine the 4 hour BCHUSD chart from Bitfinex, while plotting the 50 period SMA, the Williams Alligator indicator, and the MACD indicator, as shown on the below chart. We can note the following:

A major bearish wave began controlling the market during Tuesday's later sessions, pulling bitcoin cash price downwards to a day low of $1,139 early on Wednesday. BCH price is likely to continue dropping towards $1,093.04, before the downtrend can reverse or even slow down.
Chart from Bitfinex, hosted on Tradingview.com
Will this strong bearish wave be broken soon?
(Note: the market is currently exhibiting high levels of volatility, so trade wisely and never invest more than what you can afford to lose).
Strong downwards trend evident on the 4 hour BCHUSD chart:
We will examine the 4 hour BCHUSD chart from Bitfinex, while plotting the 50 period SMA, the Williams Alligator indicator, and the MACD indicator, as shown on the below chart. We can note the following:

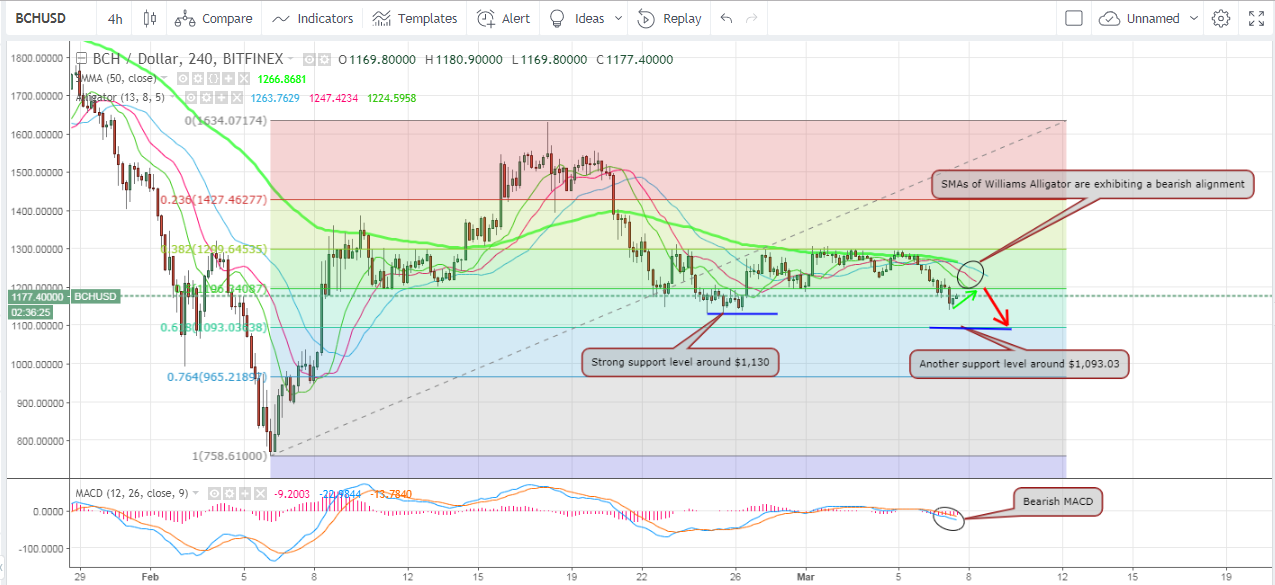
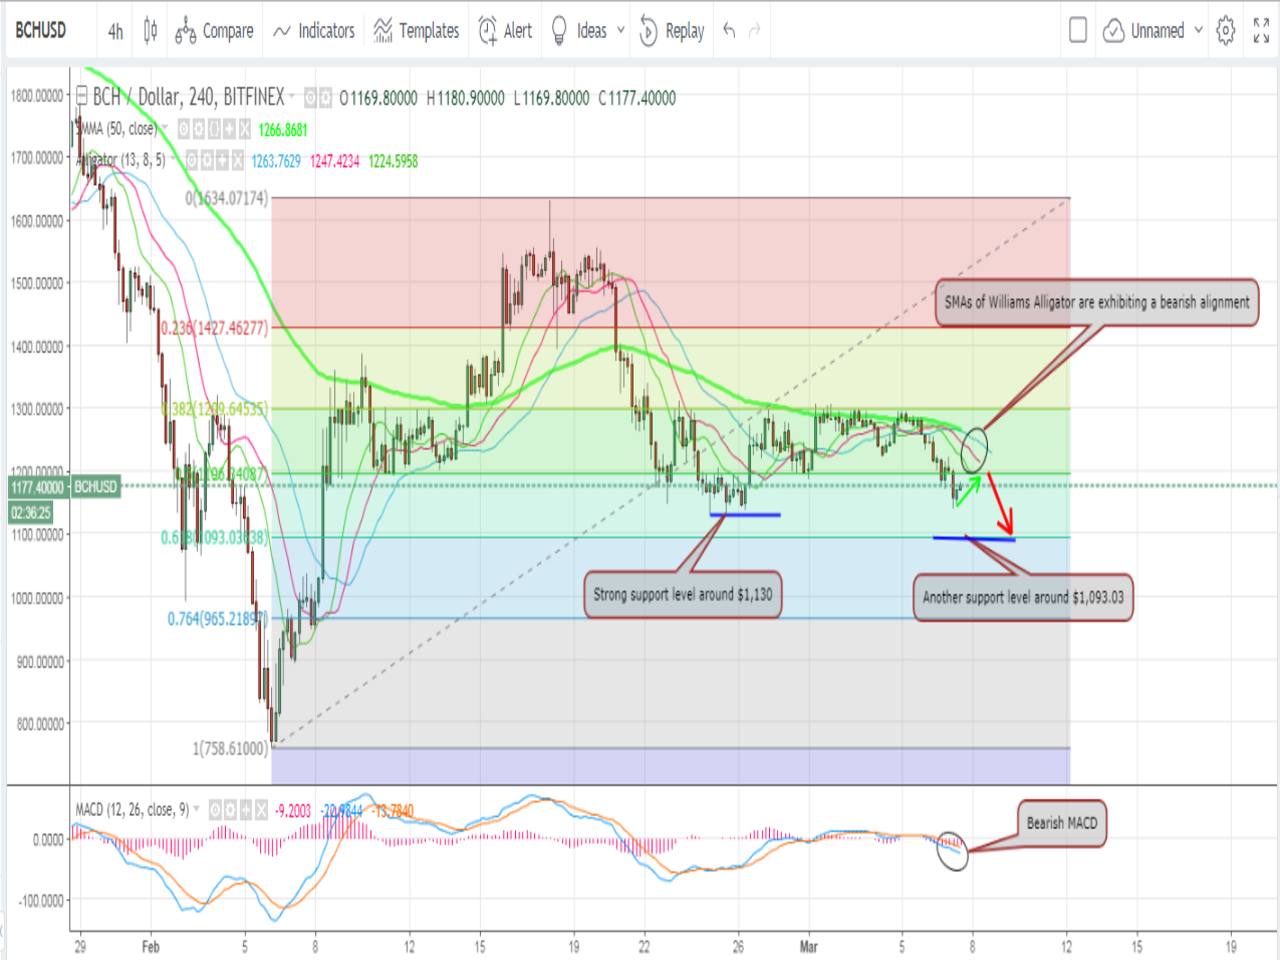
- To outline main resistance and support levels after the recent bearish rally, we will extend Fibonacci retracements between the low recorded on Feb 6th ($758.61) and the high recorded on Feb 18th ($1,634.07). Early on Wednesday, BCH price successfully breached the support level around $1,196.34, which corresponds to the 50% Fibonacci retracement.
- After dropping down to a day low of $1,139, bitcoin cash price started rising up to $1,180. The market was supported near $1,130, which represented an important support level that had prevented price drop between Feb 24th and Feb 26th. If BCH price continues to rise, it will face significant resistance near $1,196.34, which corresponds to the 50% Fibonacci retracement.
- Candlesticks are currently way below the 50 period SMA, which reflects the strength of the bearish wave that has been evident during the past 24 hours or so. The MACD is also conveying another bearish signal, as its value is in the negative territory. The MACD is sloping in a downwards direction and the red signal line is above the blue MACD line. Consequently, bitcoin cash price won't continue rising for long, before the market's bears take the upper hand and attempt pulling price downwards towards the next support levels: $1,130 and $1,093.04 respectively.
- The Williams Alligator indicator's mouth is "open and ready to eat" in the bearish direction. The red SMA (teeth) is between the blue SMA (jaw) above and the green SMA (lips) below. Also, the gap between the three SMAs is significant, which reflects that the bearish wave will remain evident for some time.
- The most logical scenario is to see BCH price rise to test the 50% Fibonacci retracement ($1,196.34) which will resist upwards price correction attempts. Thereafter, BCH price will fall where it will most probably find support around $1,093.04 (61.8% Fibonacci retracement).
Conclusion:
A major bearish wave began controlling the market during Tuesday's later sessions, pulling bitcoin cash price downwards to a day low of $1,139 early on Wednesday. BCH price is likely to continue dropping towards $1,093.04, before the downtrend can reverse or even slow down.
Chart from Bitfinex, hosted on Tradingview.com

