Ethereum price continued on dropping throughout the day, as yesterday's bearish momentum continued building up throughout the day's trading sessions. Ether price plummeted below the $1,000 price level to record a day low of $966.64 a few hours ago. So, will ether price continue on dropping? or, can we see a reversal of this downtrend soon?
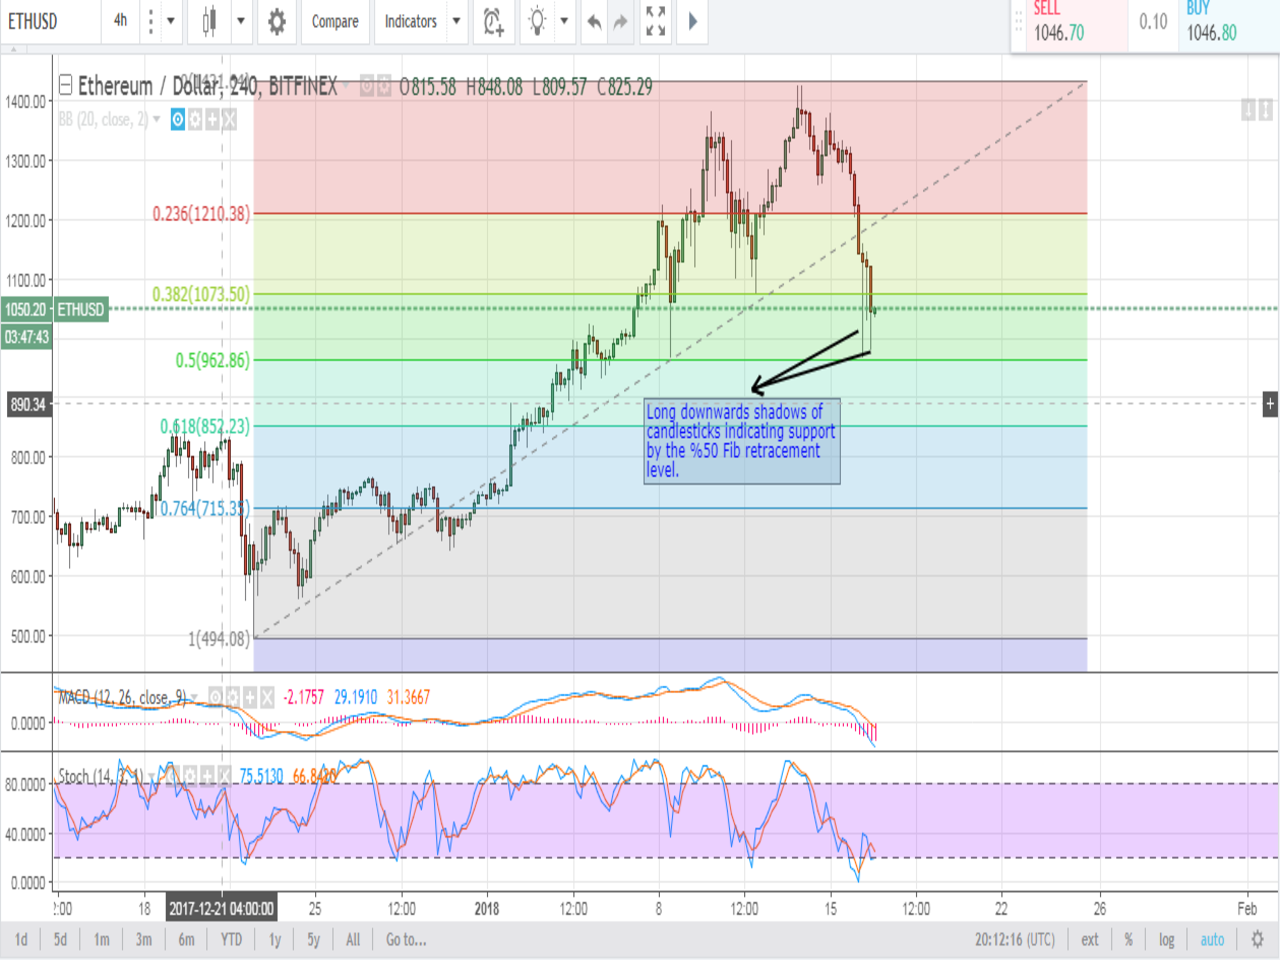
First, we should take a look at the 4 hour ETHUSD chart to pinpoint key resistance and support levels, via plotting a Fibonacci retracement extending between the low recorded on Dec. 22, 2017 ($494.08) and the high recorded on Jan. 13 ($1,431.64) as shown on the below chart from Bitfinex. The 50% Fib retracement, which corresponds to the $962.86 price level, is acting as a relatively strong support level that is preventing further price drop. This is evidenced by the relatively long downwards shadows of candlesticks, and the formation of a "hammer" candlestick pattern as price approached this key support level. Consequently, it is possible to see the downtrend reverse if the 50% Fib retracement continues to support price and prevent further drop; however, this cannot be confirmed by the MACD indicator which exhibits a bearish momentum and is still in the negative territory. Also, the Stochastic oscillator is in favor of the continuation of the bearish trend, as its value has just increased above twenty denoting that ether is not oversold, so conditions are favorable to see even lower price levels.
To sum up, if the $962.86 level continues on supporting ether price, today's downtrend can be reversed within the next 24 hours or so, and we can see price gear up towards the next resistance around the 38.2% Fib retracement, which corresponds to the $1073.50 price level. However, if the MACD and the Stochastic continue to exhibit bearish signals, the 50% Fib retracement can be breached, and we can see ether price head down to test the next support level around $852.23, which corresponds to the 61.8% Fib retracement.
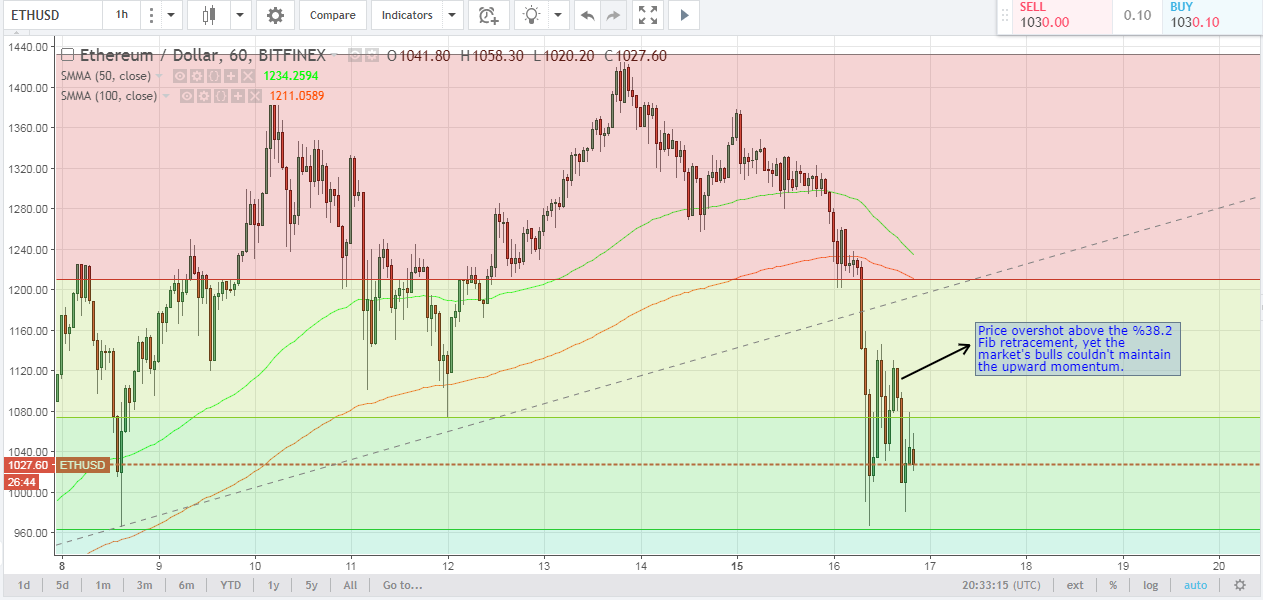
Now, let's take a look at the 11-hourETHUSD chart from Bitfinex, while keeping the Fib retracements from the previous charts and plotting the 50 period SMMA and the 100 period SMMA (look at the below chart). We can note the following:
- Ether price managed to increase past the 50% Fib retracement and exceed $1,000, yet the market's bulls were not able to maintain the upwards momentum and price dipped below this important resistance level.
- Ether price is still way below both the 50 period SMMA and the 100 period SMMA, which is in favor of continuation of the downwards trend that has been building up during most of the day's trading sessions.
- If price cannot increase past the resistance around the 50% Fib retracement ($1073.50) during the next 8-12 hours, we are likely to see price dip below $962.86 to test the next support level around $852.23
Conclusion
Ethereum price plummeted throughout today's trading sessions to record a low of $966.64. Even though the 50% Fibonacci retracement seems to be supporting price quite well around the $962.86 price level, we cannot confirm the reversal of the downtrend sometime soon via analysis of the charts. Possibly, we can see price dip to attempt testing the support level around $852.23 within the next 48 hours or so.
Charts Credit: Bitfinex hosted on Tradingview.com

