Ethereum price has witnessed a steep decline throughout the past week, falling from around $870 last Monday to a week low of $637 on Friday. An upwards price correction attempt started on Friday and took price up to $743 on Saturday, before plummeting again to $692 on Sunday, at the time of writing of this ethereum price analysis. Ethereum lost around 20% of its market capital during the past week.
Will ethereum price continue falling during the upcoming week?
Downwards sloping resistance level evident on the 4 hour ETHUSD chart:
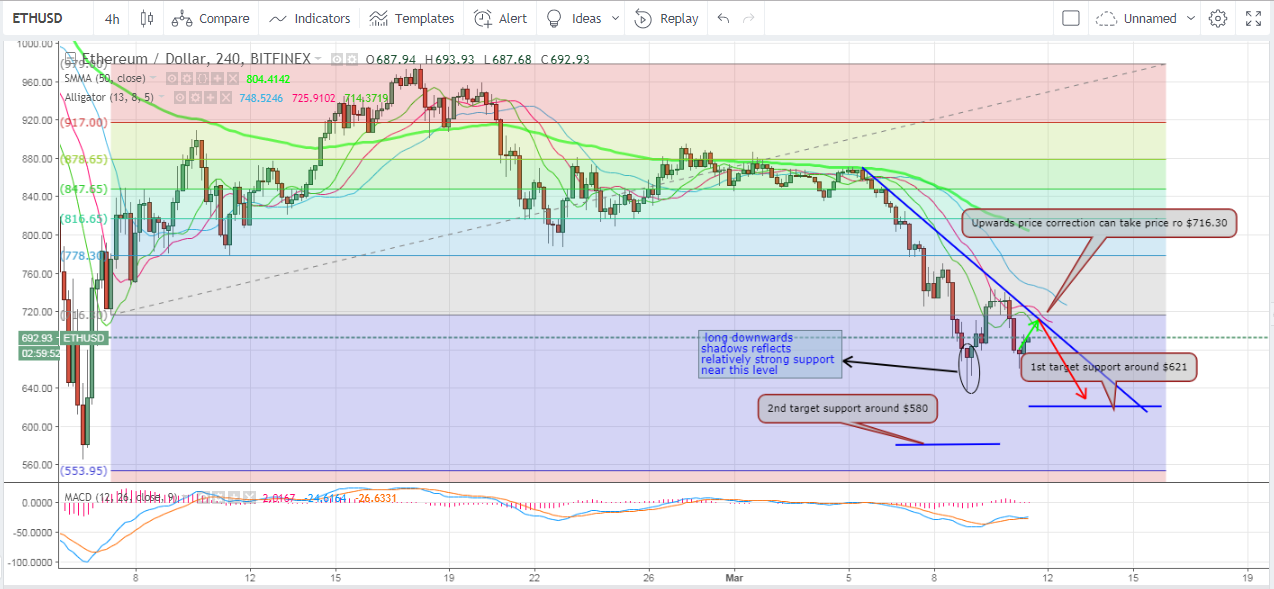
We will examine the 4 hour ETHUSD chart from Bitfinex, while plotting the Williams Alligator indicator, the 50 period SMA, and the MACD indicator. We will also extend Fibonacci retracements between a low of $716.30 and a high of $979, as shown on the below chart. We can note the following:
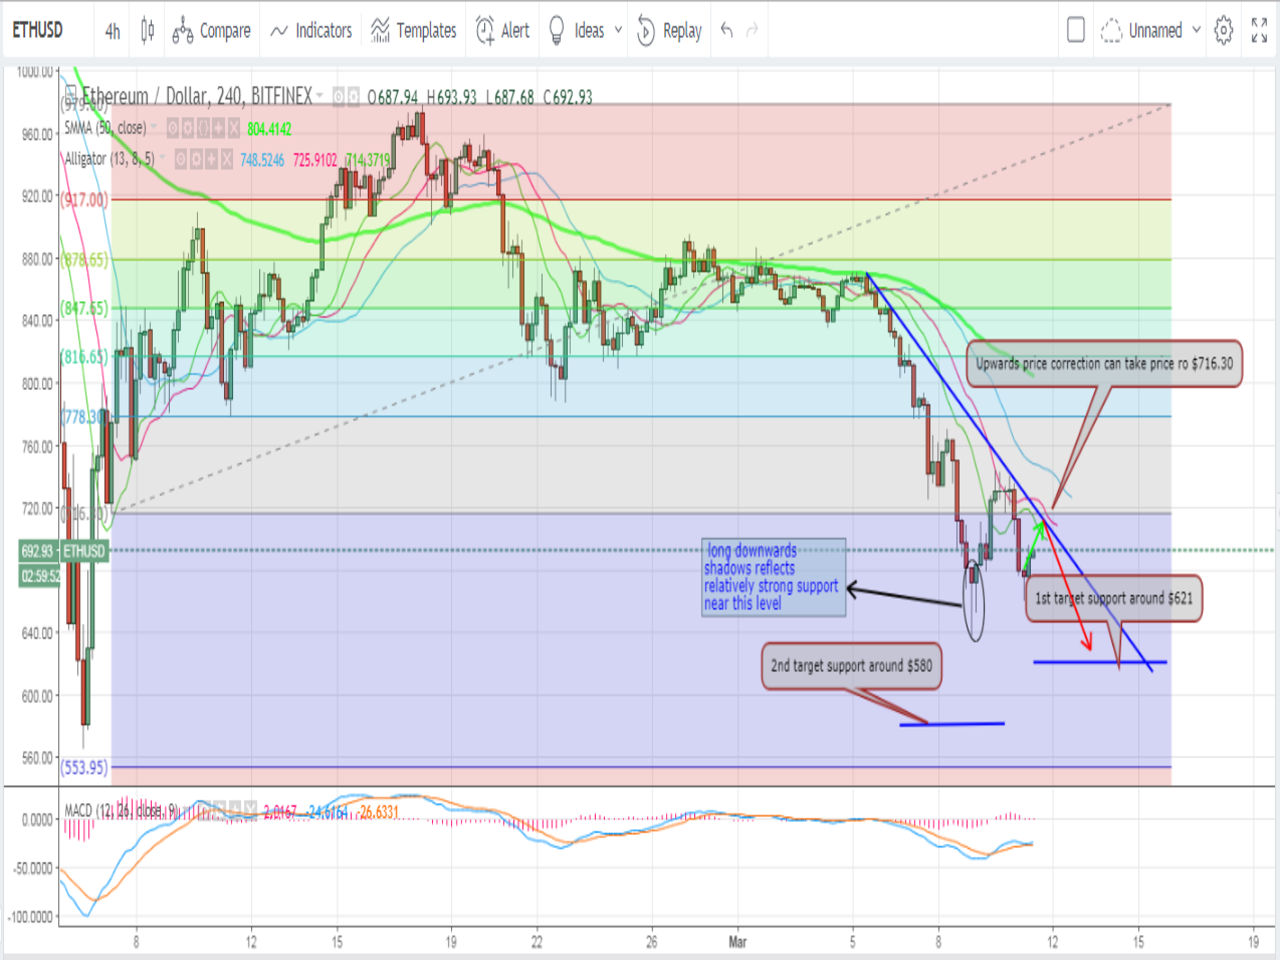
- Ethereum price fell down below the support level around $716.30 (the 100% Fibonacci retracement) last Thursday and continued dropping throughout Friday's trading sessions to a day low of $637. Thereafter, the price soared a bit as the market was supported between $630 and $640, as evidenced by the relatively long downwards shadows of candlesticks around this price level (the pair of candlesticks highlighted by an ellipse on the above chart). The upwards price correction attempt took ethereum price to a day high of $743 on Saturday. However, the bearish trend took over the market again after Saturday's day high was recorded pulling ethereum price downwards to a low of $660 so far during Sunday's trading sessions.
- A new downwards sloping resistance level is now evident on the 4 hour chart (the blue sloping trend line on the chart. The big slope of this line reflects the strong bearish trend that is currently controlling the market. On Saturday, ethereum price bounced off this resistance level and started dropping shortly after rising above the resistance level around $716.30. Currently, an upwards price correction attempt is just starting and can take ethereum price up again near $716.30, but the downwards sloping resistance level will most probably resist this attempt and the price will start falling again after bouncing off of this important resistance level.
- On the downside, ethereum price will find support around $621, which can ignite another upwards price correction attempt. The next support level will be around $580, which is much stronger than $621. We can't expect the current bearish wave to be completely reversed except after dipping down to the level of $580.
- The continuation of the bearish wave can be confirmed by the signals obtained from many indicators and oscillators. Candlesticks are still way below the 50 period SMA, and the 100 period SMA. Also, the MACD indicator is still in the negative territory and the red signal line is above the blue MACD line. The Williams Alligator indicator is also conveying a bearish signal. As such, ethereum price will most probably drop down to $621, or even down to $580, before the bearish wave can reverse or even slow down.
Conclusion:
Ethereum price lost around 20% of its market value during the past week. The market has been moving along a steep downwards sloping resistance level that can take ethereum price down to $621, or even $580, before the current bearish wave can be reversed.
Chart from Bitfinex, hosted on Tradingview.com

