Ethereum price has risen to a high of around $882 during Monday's trading sessions, after a new upwards trend became evident since last Friday. Ethereum price continued rising during Tuesday's sessions reaching $892, at the time of writing of this analysis. Right now, the market is about to test an important resistance near the $894 price level.
So, where can we expect ethereum price to be during the upcoming week?
Testing the resistance around the 38.2% Fibonacci retracement level:
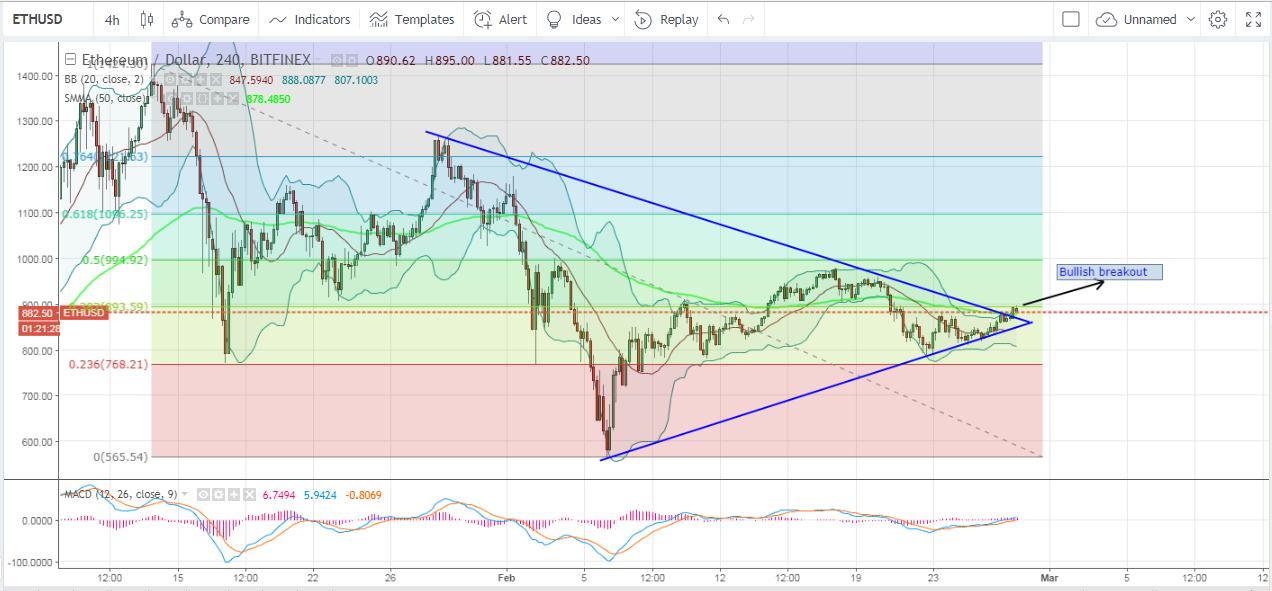
Let's examine the 4 hour ETHUSD chart from Bitfinex, while plotting the 50 period SMA, the Bollinger Bands indicator, and the MACD indicator, as shown on the below chart. We can note the following:
- To identify key resistance and support levels at the current market conditions, we can plot Fibonacci retracements that extend between the high recorded on January 13th ($1,424.30) and the low recorded on February 6th ($565.54). As evident on the chart, ethereum price is now attempting to breach the resistance level around the 38.2% Fibonacci retracement, which corresponds to $893.59.
- Since January 28th, the upside potential of ethereum price has been governed by a downwards sloping trend line. Whenever candlesticks approached this trend line, the price has been forced to bounce off it as shown on the above the chart. Similarly, the downside potential has been governed by an upwards sloping trend line. The convergence of both trend lines forms a triangle. Ethereum price has just broken out of this triangular pattern and will most probably exhibit an even stronger bullish wave during the upcoming few days. As such, the resistance around the 38.2% Fibonacci retracement will most probably be breached.
- Ethereum price is now above the 50 period SMA (green curve). This reflects that the bullish momentum is building up. However, candlesticks are currently near the upper Bollinger band, which means that ethereum is more or less overbought at the current price level. So, we might see a downwards price correction attempt that pulls price downwards near $820, before the market's bulls take the upper hand again and exceed the resistance around $893.59.
- The MACD indicator is sloping in an upwards direction. Its value has just moved into the positive territory. Moreover, the blue MACD line has just crossed above the red signal line. As such, the MACD is conveying a bullish signal that confirms that the resistance around the 38.2% Fibonacci retracement will most probably be broken during the upcoming 24 hours. Most probably, this crucial resistance level will be tested more than once, before it is successfully breached and ethereum price head towards the next significant resistance level around $994.92 (50% Fibonacci retracement).
Conclusion:
Ethereum price continued on rising along the new uptrend line that has been evident since last Friday. The market's bulls managed to take the price up to $892 during Tuesday's trading sessions. The resistance around the 38.2% Fibonacci retracement is currently being tested. As per our technical analysis, ethereum price will most probably breach this resistance level and rise above $893.59 during the next 24 hours. However, a downwards price correction attempt might become evident prior to a strong upwards trend that will push ethereum price upwards near the $900 price mark.
Chart from Bitfinex, hosted on Tradingview.com

