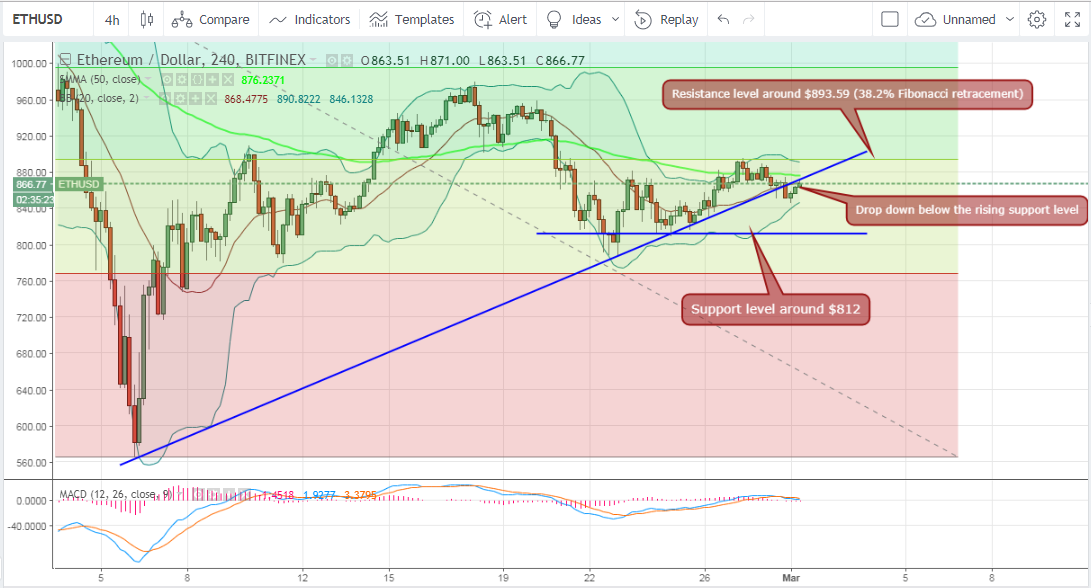
Ethereum price dropped down to a day low of $850.75 during Wednesday's latest four hour trading session. Wednesday's daily low took ethereum price slightly below the rising support level which has been evident since February 6th. However, on Thursday ethereum price rose from an opening price of $851.25 to $870 to attempt soaring above the rising support level again.
How low can ethereum price go, before it can rise again towards the next resistance level around $893.59?
Falling below the rising support level:
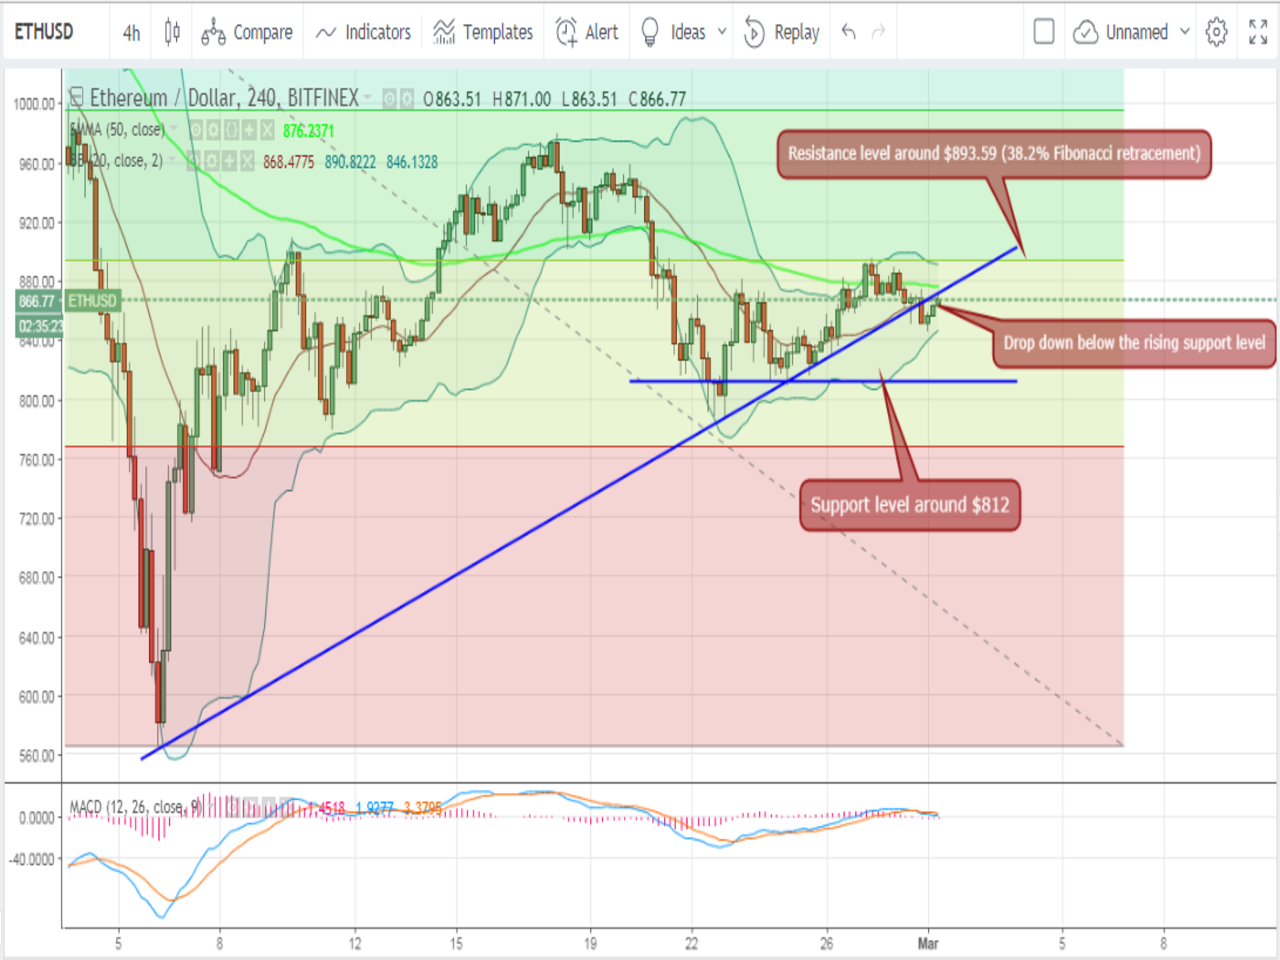
Let's examine the 4 hour ETHUSD chart from Bitfinex, while plotting the 50 period SMA (green curve), the Bollinger Bands indicator, and the MACD indicator, as shown on the below chart. We will also plot Fibonacci retracements extending from a $565.54 low to a $1,424.30 high. We can note the following:
- During Wednesday's trading sessions, ethereum price plummeted from a day high of $888.61 to a day low of $850.75, accounting for a 4% price drop within less than 24 hours. The price dropped below the rising support level (upwards sloping blue trend line on the above chart) during Wednesday's last four hour trading session. A bearish (red) candlestick, with a relatively long body, was formed right after dropping below the rising support level, which reflects how resistance greatly weakened below this level.
- The rising support level prevented ethereum price from dropping below it during the past three weeks. As such, due to the strength of support around this level, analysis shows ethereum price will most probably rise again above it within the next 24 hours, so that Wednesday's drop would be nothing more than a brief overshooting drop below support that was soon corrected. This is evidenced by how ethereum price began rising when candlesticks started touching the lower Bollinger band. If the market's bulls can successfully push price above the rising support level again, we will most probably see the 38.2% Fibonacci retracement level ($893.59) tested before the current week is over.
- Alternatively, a bearish move can pull price downwards near $812, before the market's bulls can take the upper hand again and attempt pushing price above the rising support level. The bearish move is not unlikely to occur, especially that ethereum price is still below the 50 period SMA. Also, the MACD indicator is bearish as the red signal line has crossed above the blue MACD line. Therefore, even if ethereum price falls, the downtrend will be reversed by the support level around $812. The strength of support around this level is evidenced by the relatively long downwards shadows of candlesticks near this price level.
Conclusion:
Ethereum price dropped slightly below the rising support level, which has been evident since February 6th, during Wednesday's trading sessions. However, the market's bulls took the upper hand again during Thursday's early trading sessions pushing the price up to $870. Currently, the market seems indecisive, so the price may drop near $812, before rising again to test the resistance around $893.59.
Chart from Bitfinex, hosted on Tradingview.com

