After an upwards price correction attempt that lasted for around three days, ethereum price continued dropping during last week's trading sessions. Last week's price correction attempt pushed ethereum price to a week high of $590. After the week's high was recorded, ethereum price started to drop steadily reaching $458, at the time of writing of this analysis. The market is about to test an important support level around $452, which represents the level that supported price and prevented further drop on March 18th.
How low can we expect ethereum price to reach during this week's trading sessions?
New downwards trend line evident on the 4 hour ETHUSD chart:
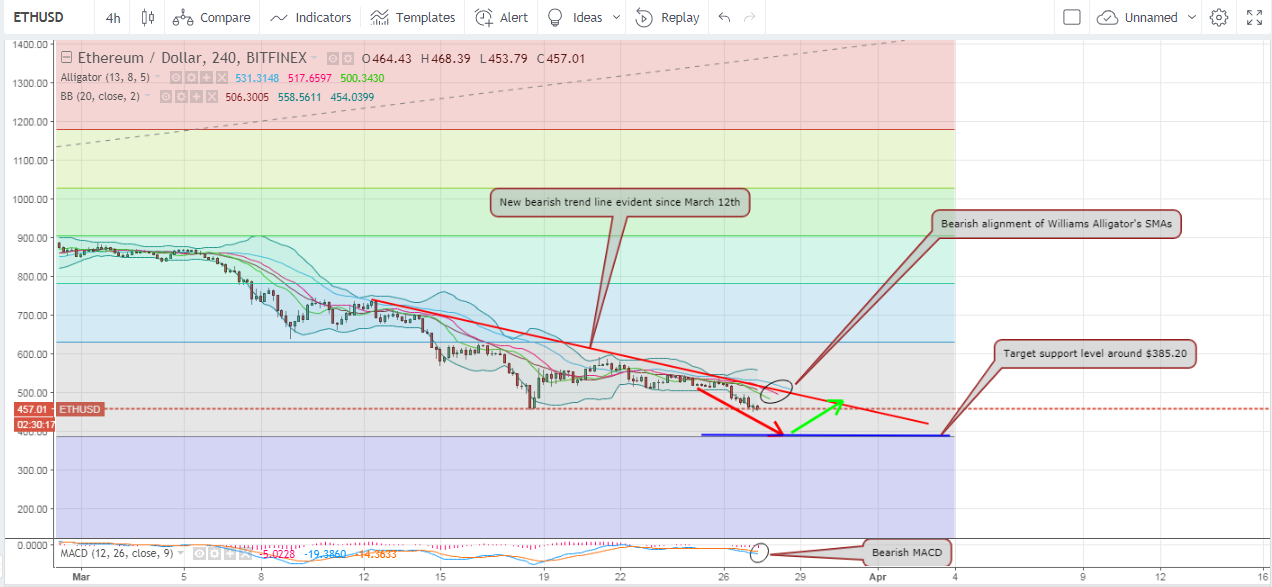
Let's examine the 4 hour ETHUSD chart from Bitfinex, while plotting the Bollinger Bands indicator, the Williams Alligator's SMAs, and the MACD indicator, as shown on the below chart. We can note the following:
- A new downwards trend line is evident now on the chart by connecting the price highs since March 12th (downwards sloping red trend line on the above chart). The current downwards wave is characterized by bearish bursts followed by brief weaker upwards price correction attempts that are mostly resisted by the downwards sloping trend line. Right now, the market is testing an important support level around $452, which resisted further price drop on March 18th.
- To identify main important and support levels as per the current market conditions, we will plot Fibonacci retracements extending between the high recorded on January 13th, 2018 ($1,424.30) and the low recorded on November 30th, 2017 ($385.20). As such, the market's bears will mostly face resistance near the support level at $385.20, after breaching the support level around $452, which will most probably occur during the current week as evidenced by the technical indicators as we will see later.
- A strong bearish momentum is still controlling the market. This is evidenced by the MACD indicator, which is currently sloping in a downwards direction and its value is in the negative territory. Also, the red signal line is above the blue MACD line, and both lines are converging further away from each other, which reflects the strength of the current downwards trend.
- Williams Alligator is also currently conveying a strong bearish signal. The gap between the three SMAs is relatively large. The blue (jaw) SMA is above the red (teeth) SMA, and both are above the green (lips) SMA. The bearish alignment began to become more prominent last Monday and our analysis shows ethereum price is likely to continue dropping during the current week towards $385.20.
- Currently, candlesticks are tangential to the lower Bollinger Band. As evident on the above chart, since March 12th, the downwards price movement has been always followed by an upwards price correction attempt whenever candlesticks touched the lower Bollinger Band. Consequently, the most logical scenario this week is to see ethereum price drop down near $385.20, after which an upwards price correction attempt will take price up to the level of the new downwards trend line (red trend line).
Bearish Ichimoku Cloud on the 1 day ETHUSD chart:
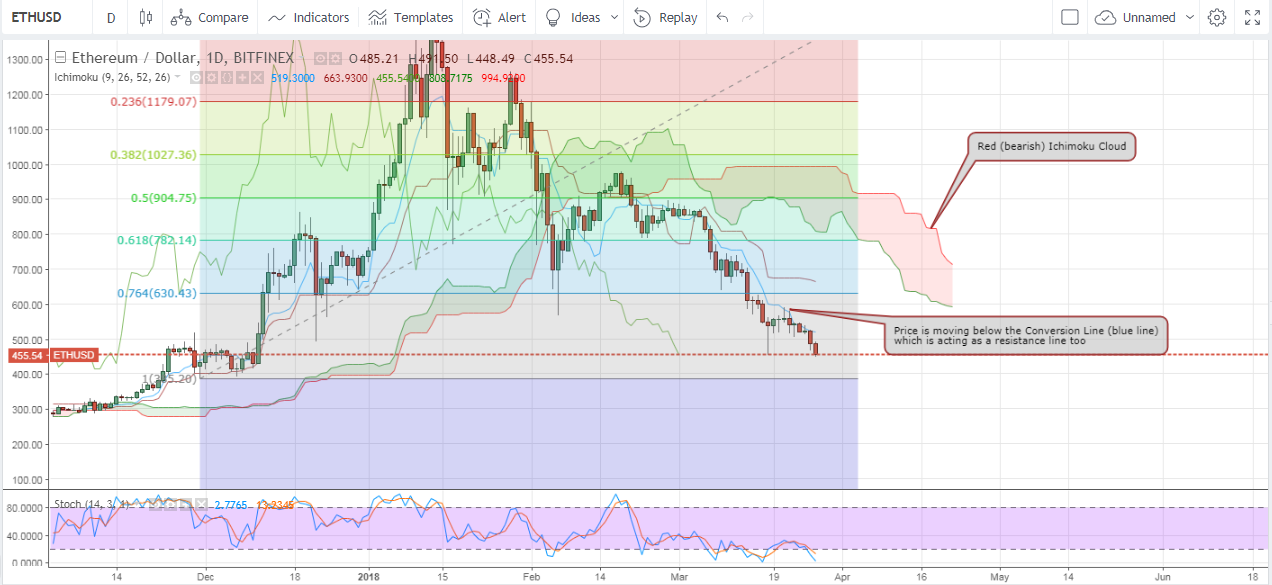
Now, let's study the 1 day ETHUSD chart from Bitfinex, while plotting the Stochastic oscillator and executing the Ichimoku Cloud indicator. We will also keep the Fibonacci retracements we plotted on the 4 hour chart. We can note the following:
- Four bearish (red) candlesticks and two dojis have been formed during the past six days. This reflects that the bearish wave is still active and strong.
- The Ichimoku Cloud is red (bearish). Also, the Base Line (red line) is above the Conversion Line (blue line). Candlesticks are below the cloud and below the Conversion Line. Moreover, the Conversion Line is acting as a resistance level that has been preventing further price rise since the beginning of March.
The Stochastic oscillator's value is currently below 20, which reflects that ethereum is more or less oversold, so an upwards price correction attempt is likely to become evident after the market bounces off the support level around $385.20
Conclusion:
Ethereum price continued dropping during last week's trading sessions, after a brief upwards price correction attempt that took the price to a week high of $590. As per our technical analysis, ethereum price is likely to continue dropping towards $385.20, which an important support level that can trigger an upwards price correction attempt.
Charts from Bitfinex, hosted on Tradingview.com

