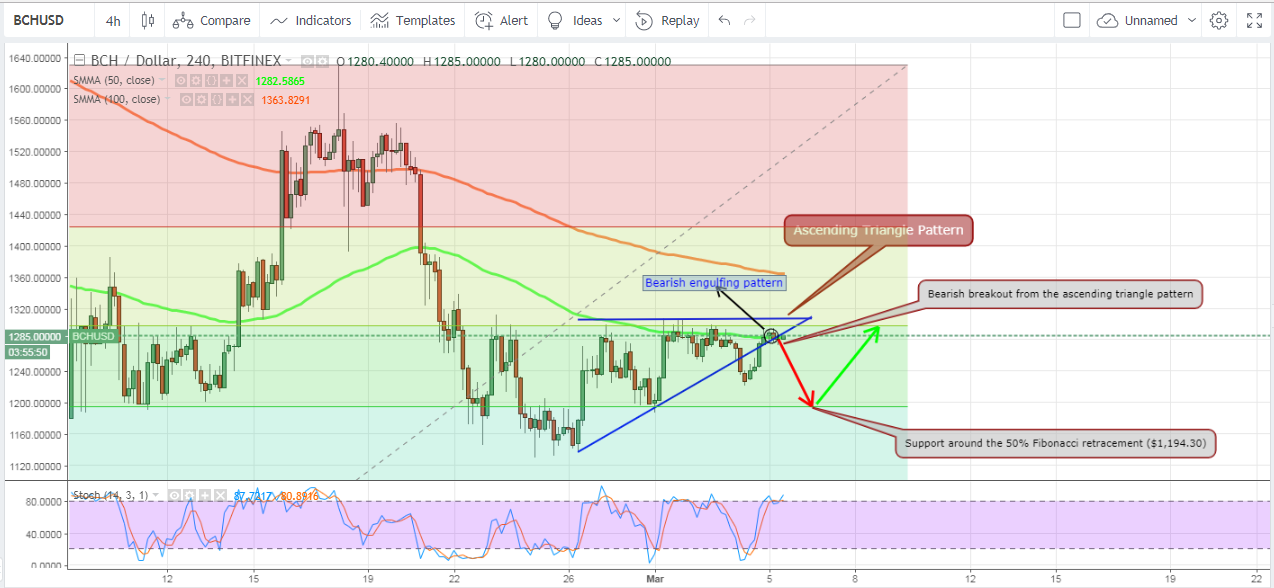
After plummeting to a day low of $1,220 on Sunday, bitcoin cash price has been rising ever since scoring a high of $1,294 so far during Monday's trading sessions. The market's bulls have failed to push price above the horizontal line of the ascending triangle pattern we spotted during our bitcoin cash price analysis on March 1st. However, higher lows have been recorded during most of the 4 hour trading sessions since February 26th.
As candlesticks are about to break out of the ascending triangle pattern, where can we expect bitcoin cash price to be during the next 24 hours?
Let's examine the 4 hour BCHUSD chart from Bitfinex, while plotting the 50 period SMA, the 100 period SMA, and the Stochastic oscillator, as shown on the below chart. We will keep the ascending triangle pattern we plotted during our previous analysis. We can note the following:

Bitcoin cash price rose to $1,294 during Monday's early trading sessions. The market is about to break out of an ascending triangle pattern in a downwards direction. According to our technical analysis, bitcoin cash price will most probably drop during the upcoming 24 hours to attempt testing the support level around $1,194.31 (50% Fibonacci retracement).
Chart from Bitfinex, hosted on Tradingview.com
As candlesticks are about to break out of the ascending triangle pattern, where can we expect bitcoin cash price to be during the next 24 hours?
Breaking out of the ascending triangle pattern:
Let's examine the 4 hour BCHUSD chart from Bitfinex, while plotting the 50 period SMA, the 100 period SMA, and the Stochastic oscillator, as shown on the below chart. We will keep the ascending triangle pattern we plotted during our previous analysis. We can note the following:

- To identify main resistance and support levels as per the current market conditions, we will extend Fibonacci retracements between the low recorded on February 6th ($758.61) and the high recorded on February 18th ($1,630). As shown on the above chart, the horizontal line of the ascending triangle pattern is slightly above the level of the 38.2% Fibonacci retracement ($1,297.13). This level represents a relatively strong resistance level that hasn't been breached since February 23rd, despite being tested several times.
- Bitcoin cash price dropped temporarily below the rising support level of the ascending triangle pattern during Sunday's early sessions, yet it rose above it again during the day's last 4 hour session. During Monday's early sessions, a "bearish engulfing" candlestick pattern has been formed. This pattern signals reversal of the short upwards trend that was evident during most of Sunday's sessions. As such, we expect bitcoin cash price to begin falling, especially that the ascending triangle pattern is completed and candlesticks are about to break out of the pattern.
- A breakout of an ascending triangle pattern usually occurs in a downwards direction. As such, we can expect bitcoin cash price to drop during the upcoming 24 hours towards the next support level which lies around the 50% Fibonacci retracement ($1,194.31). This level will most probably prevent further price drop and will mark the beginning of a new upwards trend.
- Bitcoin cash price is currently way below the 100 period SMA. Also, it is just below the 50 period SMA, which is acting as a form of resistance level that has been preventing the occurrence of a strong upwards trend. The Stochastic oscillator is also conveying another bearish signal which confirms that a bullish move is very unlikely to occur. The Stochastic currently has a value of 81.5, so we can say that bitcoin cash is overbought ( value > 80). As such, the price will most probably drop during the upcoming 24 hours.
Conclusion:
Bitcoin cash price rose to $1,294 during Monday's early trading sessions. The market is about to break out of an ascending triangle pattern in a downwards direction. According to our technical analysis, bitcoin cash price will most probably drop during the upcoming 24 hours to attempt testing the support level around $1,194.31 (50% Fibonacci retracement).
Chart from Bitfinex, hosted on Tradingview.com

