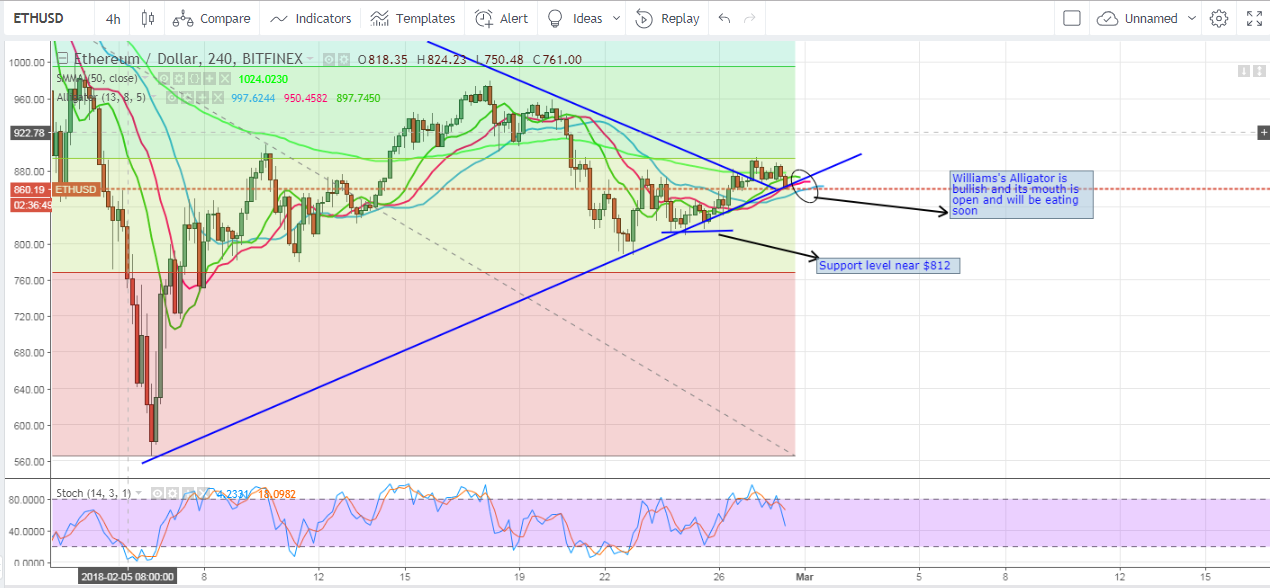
Ethereum price recorded a high of $895 during Tuesday's trading sessions, but the market's bulls failed to maintain price above the 38.2% Fibonacci retracement ($893.59). During most of the past 24 hours, ethereum price has been moving sideways between $870 and $890. Even though candlesticks have broken out of the triangle pattern we spotted during Tuesday's ethereum price analysis, we didn't witness a strong bullish move yet.
So, will the resistance around $893.59 (38.2% Fibonacci retracement) be tested again soon?
Testing the rising support level:
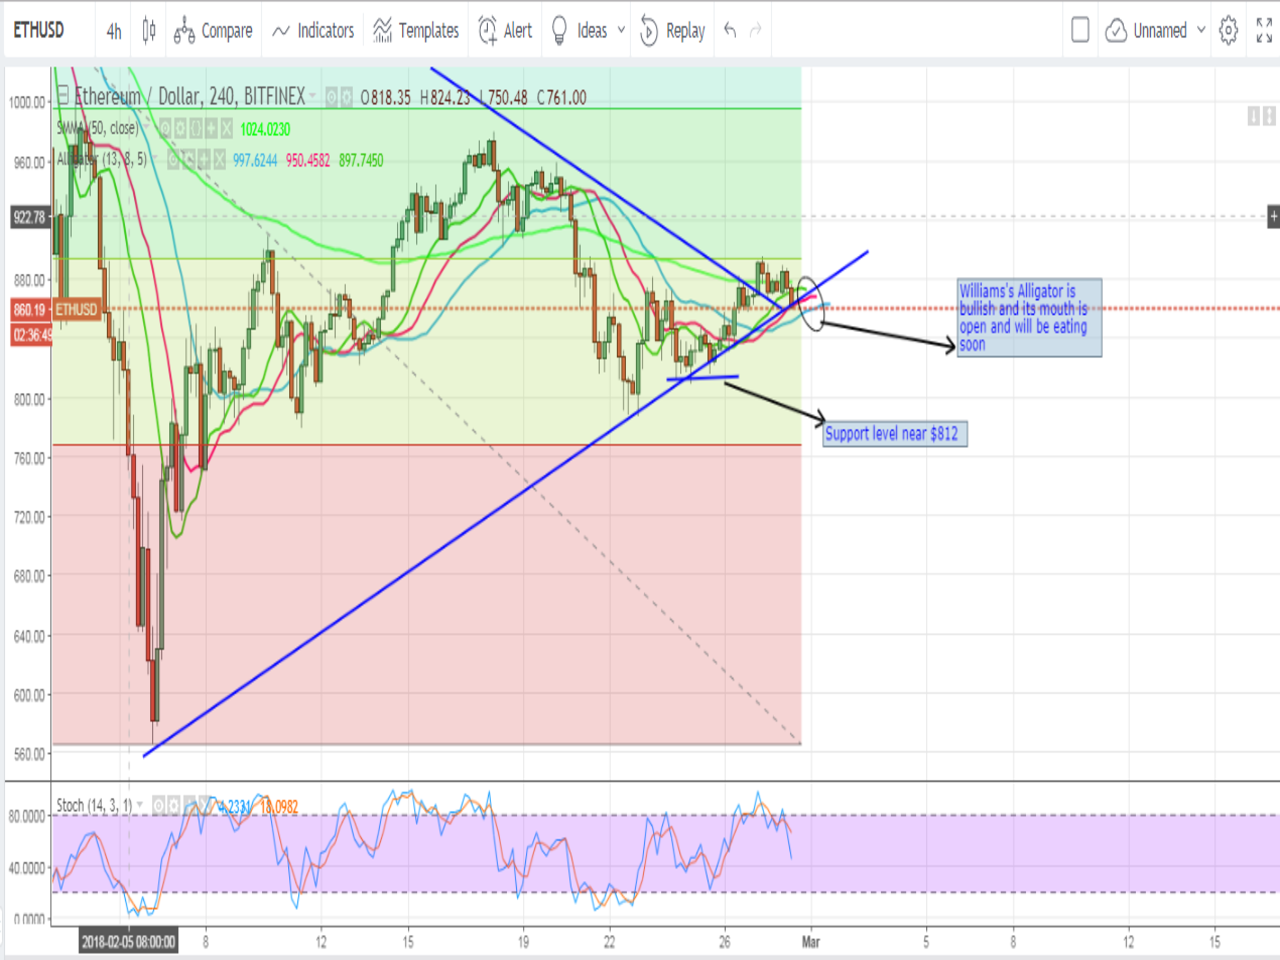
We will examine the 4 hour ETHUSD chart from Bitfinex, while plotting the 50 period SMA, the Williams Alligator indicator, and the Stochastic oscillator. We will keep the triangle pattern and the Fibonacci retracements we plotted during Tuesday's ethereum price analysis, as shown on the below chart. We can note the following:
- After breaking out of the triangle pattern, ethereum price tested the resistance around $893.59 (38.2% Fibonacci retracement). Even though the price overshot above this crucial resistance level recording a daily high of $895, it bounced off it during the following four hours. All through Tuesday's trading sessions, ethereum price has been oscillating above and below the 50 period SMA across the range between $870 and $890.
- On Wednesday, ethereum price broke out below $870 falling down to $860 at the time of writing of this analysis. As shown on the above chart, the price is currently testing the rising support level which has been marking price movements since February 6th. As candlesticks have been above this support level during the past three weeks, ethereum price will mostly bounce off it shortly and head towards higher levels again.
- Ethereum price will most probably rise again towards $893.59 during the next 24 hours or so. This is evidenced by the bullish alignment of the SMAs of the Williams Alligator indicator. The alligator opened its mouth during Tuesday's trading sessions. The red SMA (jaw) is currently between the green SMA (lips) above and the blue SMA (jaw) below. If the SMAs keep the same alignment while the gap between them increases, this can be translated into an even stronger bullish signal.
- The 50 period SMA is currently above the level of ethereum price. We have to see candlesticks start forming above this key moving average, before we can witness a prominent move towards the North. The Stochastic currently values around 53, dropping down from a peak value of around 95 during Tuesday's trading sessions. As such, we can see the price rise again towards the 38.2% Fibonacci retracement, due to the fact that ethereum is not overbought at the current market conditions.
- After bouncing off the rising support level (between $855 and $860) , ethereum price will rise towards $895.59, especially that there will be no significant resistance along the way. The next target level will be around $920.
Conclusion:
Ethereum price has been moving sideways since it failed to test the resistance around $893.59 during Tuesday's trading sessions. Currently, the market is testing the rising support level that has been evident since February 6th. As per our technical analysis, ethereum price will most probably bounce off the rising support level and will attempt retesting the 38.2% Fibonacci retracement again during the next 24 hours.
Chart from Bitfinex, hosted on Tradingview.com

